Most books only give you a once-over-lightly when it comes to GDB, especially GDB breakpoints inside of Emacs. They show you how to set a breakpoint. While that is important, it doesn’t do much to tell a developer why they should use the non-sexy Emacs front end for GDB instead of some GUI. To start with GUIs don’t give you the GDB command line.
Here is the situation. CsScintilla is a CopperSpice port of Scintilla I created. Now that I’m about to release a new version of RedDiamond I made the dumb-arse decision to update to the latest Scintilla source. I’ve written on this blog about RedDiamond before. Naturally this introduced an annoying bug.

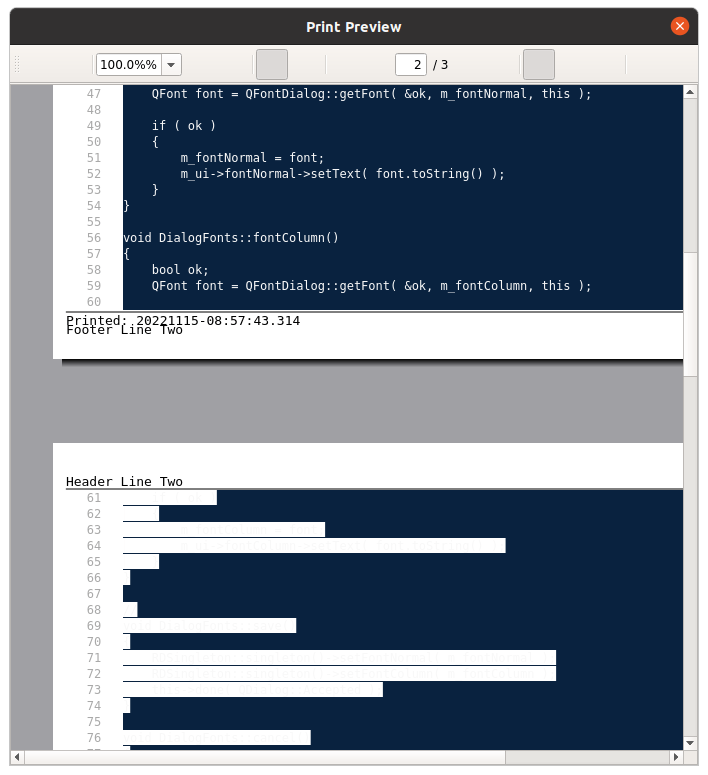
This is what lead me to working backwards from core dumps in an attempt to find the issue(s). There are at least two, one has to do with some kind of memory allocation bug when using print preview that now causes a core dump. Don’t know who is guilty there yet. I’m getting closer to identifying the guilty parties with this particular print preview bug. It is known to impact both Qt and CopperSpice based editors using Scintilla. I suspect it impacts all of them but so few have a default dark background, it doesn’t show.
What we know
If your default background is white or you choose to print preview in black and white, all is right with the world. The initial Red Herring was the “clipping” change that was rolled in. When I layered on each change individually from the last known working version the problem happened there. Commenting out the changes doesn’t seem to “undo” the problem. For those of you wanting to see the DIFF/PATCH file:
cat commit-d9bdcc6.diff
# HG changeset patch
# User Neil
# Date 1664069639 -36000
#      Sun Sep 25 11:33:59 2022 +1000
# Node ID d9bdcc6d6abbe68dc7b53c561f07c94acbcd156c
# Parent  136ec155aeeb187b31e07f56b6e7760984c26d3b
Draw lines more consistently in SC_PHASES_TWO and SC_PHASES_ONE modes by
clipping drawing to just the line rectangle.

diff --git a/doc/ScintillaHistory.html b/doc/ScintillaHistory.html
--- a/doc/ScintillaHistory.html
+++ b/doc/ScintillaHistory.html
@@ -589,6 +589,12 @@
     and was exposed by ScintillaDocument in the Qt implementation of ScintillaEdit.
     </li>
     <li>
+    Draw lines more consistently in SC_PHASES_TWO and SC_PHASES_ONE modes by
+    clipping drawing to just the line rectangle.
+    This stops drawing some extreme ascenders, descenders and portions of indicators which
+    may appear and then disappear depending on which lines were drawn.
+    </li>
+    <li>
     On Win32 implement horizontal scrolling mouse wheel.
     <a href="https://sourceforge.net/p/scintilla/feature-requests/1450/">Feature #1450</a>.
     </li>
diff --git a/src/EditView.cxx b/src/EditView.cxx
--- a/src/EditView.cxx
+++ b/src/EditView.cxx
@@ -2354,6 +2354,11 @@
         return; // No further drawing
     }

+    const bool clipLine = !bufferedDraw && !LinesOverlap();
+    if (clipLine) {
+        surface->SetClip(rcLine);
+    }
+
     // See if something overrides the line background colour.
     const std::optional<ColourRGBA> background = vsDraw.Background(model.GetMark(line), model.caret.active, ll->containsCaret);

@@ -2429,6 +2434,10 @@
     if (FlagSet(phase, DrawPhase::lineTranslucent)) {
         DrawTranslucentLineState(surface, model, vsDraw, ll, line, rcLine, subLine, Layer::OverText);
     }
+
+    if (clipLine) {
+        surface->PopClip();
+    }
 }

 static void DrawFoldLines(Surface *surface, const EditModel &model, const ViewStyle &vsDraw, const LineLayout *ll,
If you manually change the background color to something dark for every style in NotepadNext, you will see the same problem.

Given the color scheme was originally designed for a white background the problem isn’t quite as horrible. It’s also a major pain to change the colors and they don’t currently save, so not really a problem at all. Thus is the situation for too many editors, which leaves me as the only one to be pissed off about it.
Prepwork
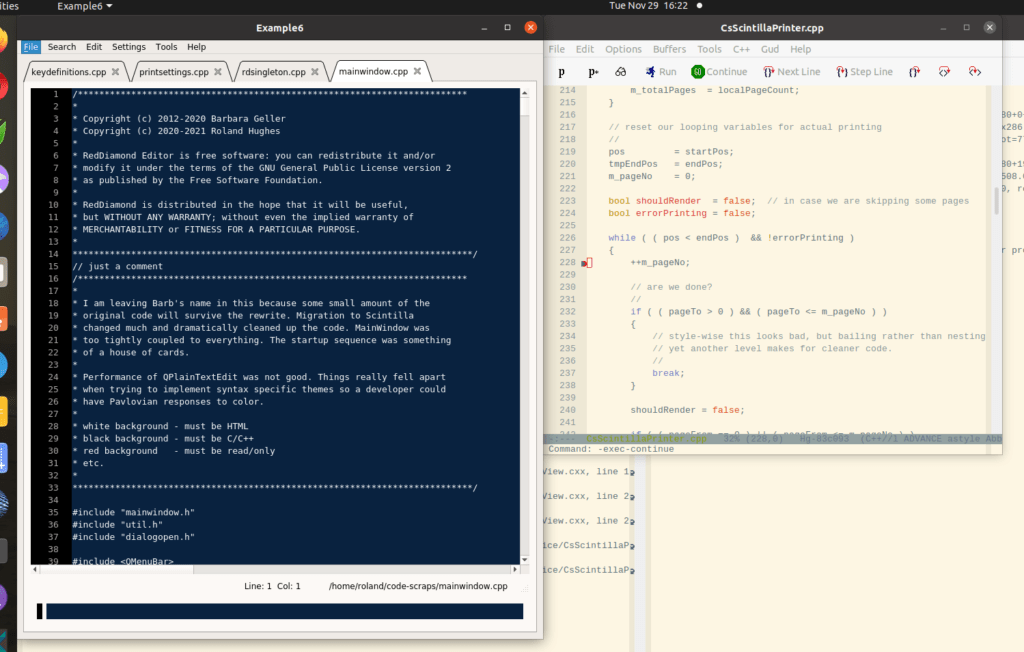
To have any prayer of tracking this down I had to have both CopperSpice and CsScintilla compiled with full debugging information. CsScintilla has Example6 which exists to show off print preview, so I’ve whittled the potential down.
NOTE: With all of your major libraries compiled in debug, initial load time will be quite long. It might take an entire minute as the debugger gathers all of the symbol information.
You also need to choose a really good color scheme for Emacs. The definition of “good” will be in the eye of the beholder, but you want one that highlights the “y” when a GDB breakpoint is active/enabled. This will become clear in a moment.
Those most important thing you can do is read through the code to identify where the likely places might be. These types of issues, given the massive code base, will not be a one-and-done debugging session. GUI debuggers are fine for simple problems. You need the GDB command line to work on serious stuff. Why?

I put all of these commands into my_breakpoints.txt in my home directory.
Rubber meets road


Here we diverge from the core dump posts. We issue the “start” command and wait for everything to get loaded. Please do not be impatient as there is a ton of stuff.

You are not actually running yet, just about to run. Some of the C/C++ library and other things have started, but you will notice the arrowhead on line 16. Your temporary GDB breakpoint is at the opening brace for main(). This is a good thing.

With a GUI debugger you have to open every source file, find the line(s) you want for breakpoints and click on them somehow.


I love the Solarized-light theme/color scheme. It can be a touch confusing since it looks like “Threads” is the highlighted tab when really “Breakpoints” is the active one. This scheme is easy on my eyes and, that red “y” is pretty obvious.
Because I did my prepwork, starting my debugging session over is pretty easy. Life gets better. These are all of the GDB breakpoints I believe I should need, but I don’t need them all to start.

That just turned all of my breakpoints off.

I only need two of them active to start. The number I need isn’t that nice big hex number like you might think. I need the number appearing at the beginning of each line.


The red “y” is prominent on the screen. You are now ready to go forth!


Summary
If you are the kind of person that can only be a “developer” when using an IDE with a GUI debugger interface, you basically suck at finding mysterious problems in large intractable code bases. Something like this takes iterative debugging passes. The hassle of having to open every file and click on ever line to set things up each and every time will have you on the roof ready for a big pavement dive in no time. Emacs gives you access to the GDB command line and from there you can make a second, or thirty second , session simple to launch.
What if you set all of the breakpoints during your initial reading of source? No problem.


It not only saves the breakpoints, it saves their current state. When you source this your breakpoints are exactly as you saved them.
Read more about Emacs and how to use it in my new book on Emacs.